The Warming overview shows four cards — Active Mailboxes, Avg Health Score (labeled Good/Fair/Poor), Avg Inbox Rate, and Today's Progress (sent vs target). Health score (0-100) is the top-line — 90+ = ready to send, 70-89 = still warming, under 70 = investigate. Inbox rate is what percentage of warming emails land in the inbox (target 85%+). Spam rate is its complement (target under 5%). Replies is a raw count of warmup replies received. Each mailbox has its own row on the Warming page with all these metrics; charts show trends over time.
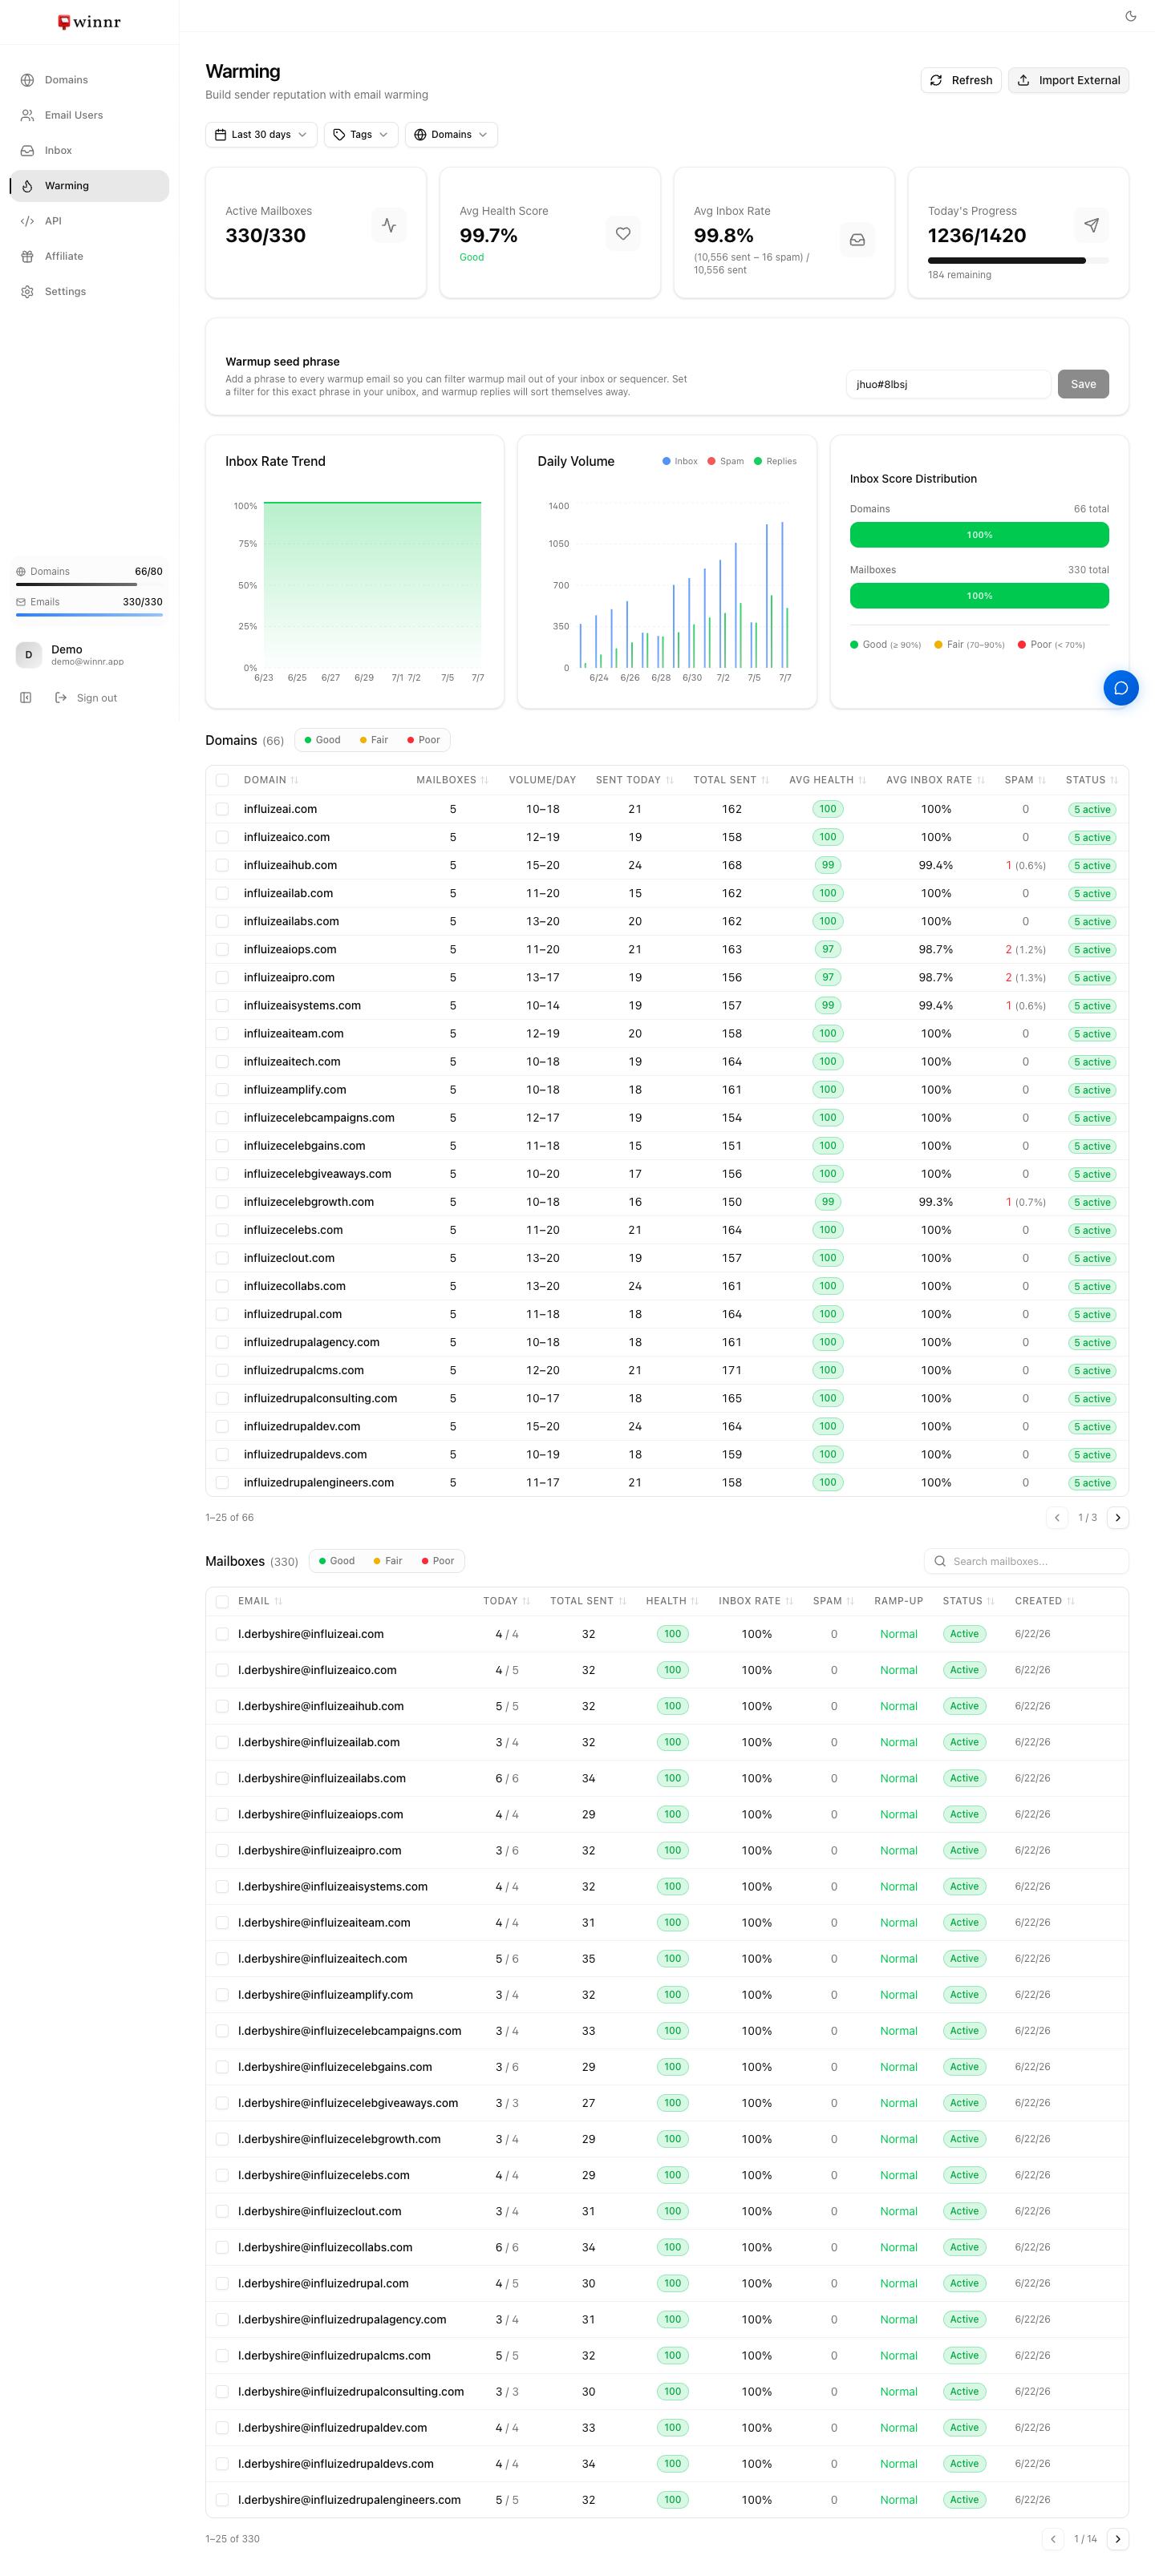
The Warming overview
The top of the Warming page shows four summary cards:
- Active Mailboxes — how many mailboxes currently have warming running.
- Avg Health Score — average health across your warming mailboxes, labeled Good / Fair / Poor.
- Avg Inbox Rate — average inbox placement, shown as (sent − spam) / sent.
- Today's Progress — warming emails sent today vs today's target, with an "N remaining" count.
Below the cards is an Inbox Score Distribution widget that groups both your Domains and your Mailboxes into three buckets — Good (≥90%), Fair (70–90%), and Poor (<70%) — so you can spot a subset that's lagging at a glance.
Health score (the top-line)
Score 0-100 that summarizes a mailbox's warming reputation. It's driven by the spam rate over recent sends: health = 100 − 2 × (spam rate). A mailbox with almost no warmup mail landing in spam scores near 100; one with a rising spam rate drops fast.
90-100 = Ready to send. Cold campaigns will perform close to the mailbox's ceiling. 70-89 = Still warming. Keep warming running. Layered cold sending at low volume (5-15/day) is fine. 50-69 = New or recovering. Give it more time. Investigate if flat for a week. Under 50 = Struggling. Something's actively wrong — check DNS, blacklists, and recent volume changes.
On the overview card the average is labeled Good / Fair / Poor rather than a raw number. Focus on trends over absolute values.
Inbox rate
Percentage of warming emails that landed in the recipient inbox rather than spam. It's the direct complement of the spam rate — inbox rate = 100 − spam rate. Range 0-100%.
- 95-100% — excellent. Rarely achievable during ramp; more common once mailbox is fully warmed.
- 85-94% — very good. Normal for weeks 2-3 of warming.
- 70-84% — okay. Normal for week 1. Concerning if it stays here past week 2.
- 50-69% — under-performing. Check DNS health, blacklists, and ramp settings.
- Under 50% — actively broken. Something is misconfigured or the domain is on a blacklist.
Spam rate
Complement of inbox rate — percentage that landed in spam. Low is good.
- Under 3% — target. Ideal steady state.
- 3-10% — okay during ramp. Should trend down toward under 3% by week 3.
- 10-20% — investigate. Something is pushing messages to spam.
- 20%+ — active problem. Pause warming, diagnose, then resume.
Replies
A raw count of warmup replies the mailbox received from Winnr's warming network. Higher = more positive engagement signal. It's a count, not a percentage — there's no reply-rate target to hit, and Winnr's warming manages reply behavior automatically.
Per-mailbox table
Each warming mailbox has its own row with these columns:
- Today — warming emails sent today.
- Total Sent — cumulative warming emails sent.
- Health — the mailbox's health score.
- Inbox Rate — inbox placement for its warmup mail.
- Spam — spam rate (the complement of inbox rate).
- Ramp-up — the ramp-speed setting (Slow / Normal / Fast).
- Status — warming / paused / not warming.
- Created — when the mailbox was created.
Trend charts
The Warming page shows two charts:
- Inbox Rate Trend — inbox placement over time. It should rise (or already be high). Sharp drops are the first signal of a DNS issue or blacklisting.
- Daily Volume — warmup mail broken into Inbox / Spam / Replies. Sent volume should rise over the first week or two as the ramp works.
Inbox Score Distribution
The Warming overview groups both Domains and Mailboxes into buckets — Good (≥90%), Fair (70–90%), and Poor (<70%). Useful for spotting a subset of underperforming mailboxes or domains in a fleet.
What's next
Frequently asked questions
My health score is 65. Is that bad?
It's below the sending-ready threshold but not necessarily bad — new mailboxes typically sit at 50-70 during the first week of warming. Watch the trend line. Rising = ramp is working. Flat for 5+ days = worth investigating.
Inbox rate is 60%. What's wrong?
60% is below where it should be after week 1 (typical 75-85%) and definitely by week 2 (85-95%). Common causes — DNS drift (check domain health), a new blacklist, or too-fast a ramp. Try dropping the ramp speed to Slow.
The spam rate spiked from 3% to 20% overnight. What now?
Almost always a DNS or blacklist issue. Check the domain's DNS health first. If green, run a blacklist check. If both clean, contact support — Winnr can look at network-level signals you can't see.
What health score do I need before starting real cold campaigns?
85+ is safe. 90+ is ideal. Below 85 means the mailbox is still building trust — sending cold campaigns from it will underperform and can undo the warming progress.
Do the metrics predict real cold-email deliverability?
Warming metrics reflect the mailbox's reputation with major providers. That reputation translates directly to real cold email — so yes, high warming inbox rate strongly correlates with high cold-email inbox rate. Not a perfect predictor (real campaigns have their own content and volume signals), but the best leading indicator you have.